Note: Starting from this article, all articles will be peer-reviewed before publication. I will do my best to keep this pre-publication strategy, although this might not be possible for all articles. Read more about this in the about page.
Article reviewed by Cody Haun, PhD and Martino Franchi, PhD
Our current understanding on skeletal muscle hypertrophy is based on the hypothesis that increases in muscle mass are driven by an accumuation of myofibrillar proteins over time. That is, muscle protein synthesis (MPS) must exceed muscle protein breakdown (MPB), so the net result is an increase in myofibrillar protein mass. This hypothesis has a solid biological base and supporting scientific evidence. However, most studies on muscle hypertrophy use methods that are not able to assess myofibrillar hypertrophy directly; rather, they use methods that are considered a good proxy for it. Moreover, besides measuring skeletal muscle size at a single time point, they are not able to differentiate what is causing the changes in muscle size. For example, the size of a muscle can be increased temporarily by augmenting blood flow (“the pump”), which returns to baseline after a short time. Is this really hypertrophy?
In this article, I will elaborate on why it might be possible that what most short-term studies (4-16 weeks) are measuring is not necessarily myofibrillar hypertrophy, rather, fluid shifts. Thus, their interpretation towards long-term muscle gain and practical applications might have to be re-assessed.
Insights into detraining
There were two main lines of evidence that prompted me to analyze this topic. First, the whole discussion about acute muscle swelling on high volume training regimens, which could confound muscle thickness (MT) values assessed by ultrasound. But most importantly, a recently published study (Roberts et al., 2018, which I will discuss in more detail later) which suggested that changes in MT were driven not by an increase in myofibrillar protein content, rather by intracellular fluid changes (“sarcoplasmic hypertrophy”*).
As nicely written in the rebuttal letter of Roberts et al., 2018, such changes could explain the observations we have on detraining and muscle size. After training cessation, there is an expected loss of muscle size. However, the time-course of this loss is pretty dramatic. After 3 months of training, untrained individuals increase their fiber cross-sectional area (fCSA) by 17%. Strikingly, these values return basically to baseline after only 10 days:

If these changes are driven by the balance between protein synthesis and degradation, then protein degradation must be upregulated drastically (within ~10 days) upon training cessation to explain the quick loss of muscle size. Conversely, changes in fluid within muscle compartments explains more easily these rapid dynamics.
How muscle hypertrophy is measured
In order to understand how short-term studies could be measuring fluid shifts instead of myofibrillar protein accretion, it is important to go over the methods we have for assessing muscle size and hypertrophy.
There are several ways in which muscle hypertrophy can be measured. Whereas magnetic resonance imaging (MRI) is considered the “gold standard”, more practical alternatives such as ultrasound (US) are commonly used.
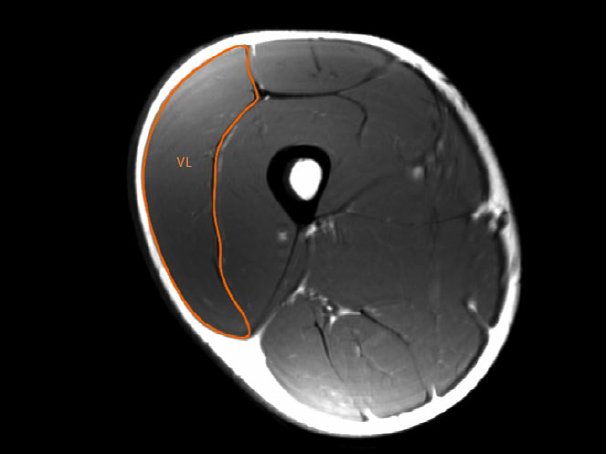
One can measure a muscle’s anatomical cross-sectional area (ACSA) by MRI, as shown in the following figure (in this case, the vastus lateralis, VL) (Franchi et al., 2018):
A cheaper, more practical and safer alternative involves measuring the muscle thickness (MT) from US images:

Most studies take measurements of the muscle at a specific point (i.e. 50% of femur length for the VL, as in both images images), and use this measurement as representative of the whole muscle.
In both cases, one can clearly differentiate the skeletal muscle from surrounding structures. However, it is not possible to determine the exact composition of the tissue within skeletal muscle. In other words, you can measure the size or area of the muscle but cannot differentiate its composition**. Thus, one can only assess if there is a change in the size (US, MRI) or volume (VOL) (MRI) of skeletal muscle, not what is driving the increase.
There appears to be a good correlation between muscle size when determined by MT, ACSA or VOL, both before and after resistance exercise (REX):

However, the correlation between the change in muscle size after REX determined by MT or VOL is very low (or non-existent, plot on the right):

Thus, while the changes in muscle size by MT and ACSA correlate well (r=0.69), things get murkier when assessing muscle size tridimensionally (r=0.33). The authors speculate that this difference might arise because of regional hypertrophy (ie. hypertrophy differs depending on the region of the muscle). Whatever the explanation, this suggests that MT and ACSA cannot capture all the morphological changes induced by REX, which is one of the main limitations of these metrics.
To know if protein concentration is actually increasing (following the hypothesis that MPS > MPB drives muscle hypertrophy), one must take a biopsy sample and measure directly the concentration of proteins before and after REX. If an increase in myofibrillar protein mass is driving the changes in muscle size as measured by MRI or US, then:
a) changes in muscle size have to occur concomitantly with changes in myofibrillar protein concentration and
b) there must be a good correlation between either the change of myofibrillar proteins and muscle size as determined by MRI or US.
Methods to quantify myofibrillar protein content
There are two main ways in which changes in myofibrillar proteins (myoP) can be assessed. The most common in resistance training research, albeit indirect, involves the use of a labeled tracer, which serves as a “marker”, to measure the rate of myofibrillar muscle protein synthesis (myoMPS). In brief, a labeled aminoacid (which is different than the rest of aminoacids and can be thus differentiated and traced) is given to subjects, either orally or by infusion, and the amount of that particular amino acid incorporated into the myoP fraction (taken from a muscle biopsy) is determined. With this, one can calculate the fractional synthetic rate (FSR), which represents the rate in which proteins are being synthesized and incorporated into myoP. A higher FSR means that proteins are being synthesized faster, so over time, a higher FSR should correspond to higher myoP concentration (more proteins are synthesized per unit of time).
However, there are certain limitations to this technique. First, it cannot differentiate proteins; it just measures “bulk” incorporation of the tracer into the myofibrillar fraction. Second, it cannot measure the recycling of aminoacids from other proteins and their contribution to the synthesis of new myoP (although measurements with deuterium oxide, which should include recycling, agree with short-term measurements performed with labeled aminoacids). Third, the FSR doesn’t necessarily correlate with protein abundance (concentration), as the actual concentration of protein depends on the balance between synthesis, degradation and delivery of pre-existing proteins to a muscle fraction. Finally, myoMPS can be elevated due to several physiological processes, including muscle damage. This appears to be particularly important when using myoMPS as a proxy for muscle growth in untrained subjects; myoMPS is only correlated with muscle hypertrophy when muscle damage is attenuated.
The second way of determining the myoP content is to directly measure the concentration of proteins from a muscle biopsy by regular biochemical techniques. This method offers the advantage that it measures the actual product one is interested in. However, one major limitation is that results may vary depending on the exact purification protocol used (see below).
Evidence of increased myofibrillar protein concentration after resistance exercise in humans
Surprisingly, direct measurement of myoP is not very common in muscle hypertrophy research. However, there are some studies that have used this metric in their methods.
Willoughby showed that 12 weeks of REX (6-8 repetitions at 85-90% of 1RM) increased myoP concetration from 150 to 250 mg/g in untrained subjects. Using a similar intervention, again in untrained subjects, 10 weeks of REX (6-8 repetitions at 85-90% of 1RM) increased myoP concentration, in a manner proportional to the increase in lean mass. Importantly, in both studies, myoP was purified using the TRIzol method, from which proteins can be difficult to solubilize. Similar results have been observed by the same group, in untrained subjects and with a similar purification protocol (SDS extraction after tissue homogenization).
Moreover, other studies by the same group, in trained subjects, have found increased myoP concentration after 6-8 weeks of training. However, another study in trained subjects (10 repetitions at 60-80% of 1RM) using a similar protein purification protocol found that lean mass gains (DEXA) and myoP concentration changes were uncoupled: both groups increased lean mass by 2% and 1.5%, whereas myoP was reduced by 7% in the former and increased 24% in the latter!
Fortunately, there is more data in trained subjects using a different myoP purification protocol. In one study, Cribb et al., 2007, compared the effect of whey protein (WP) and creatine monohydrate (CrM), alone and combined, on muscle hypertrophy in trained subjects (at least 6 months of resistance exercise) after 11 weeks of REX. They used four groups: carbohydrate (control), CHO carbohydrate + CrM (CrCHO), whey protein (WP) or whey protein + CrM (CrWP). Whereas all groups increased lean body mass (DEXA) by a similar magnitude, only the difference between CrCHO and CHO was statistically significant. Interestingly, there was a good correlation between the increase in myoP concentration (which increased in all groups) and fiber cross sectional area (fCSA), specially in type II muscle fibers:

They also observed a pretty good correlation between the change in myoP concentration and the change in squat strength (r=0.654), as well as between the change in fCSA and the change in squat strength (r=0.8 for all fiber types).
The same group, in a study comparing the effect of supplementing with a mixture of protein/creatine/glucose immediately before and after REX (PRE-POST), compared with the same supplement consumed in the morning and evening (MOR-EVE) after 10 weeks, observed a proportional increase in lean mass, myoP concentration and fCSA. The changes are shown in the following table:
| PRE-POST | MOR-EVE | |
| Lean mass | 4.0% | 1.8% |
| myoP concentration | 49.5% | 26.2% |
| fCSA (type I) | 13.2% | 11.4% |
| fCSA (type IIa) | 25.0% | 17.0% |
| fCSA (type IIx) | 25.3% | 17.8% |
With the exception of the type I fCSA, all other differences were statistically significant. Besides arguing for the importance of peri-workout nutrition (point for further discussion in a different article), these results show that, in these subjects, the increase in myoP is proportional to the increase both in lean mass and type II fCSA. Similar results have been observed by the same research group, where greater increases in lean mass were correlated with greater increases in type II fCSA and myoP concentration.
Interestingly, in these last two studies, where there was a very good correlation between myoP concentration, lean mass and type II fCSA, the training protocol performed was a high intensity-low volume routine (Max-OT), which comprises three phases:
-
- Preparatory phase (1-2 weeks): 2 working sets, 10 to 8 repetitions (70-75% of 1RM).
- Overload phase 1 (2-4): 2 working sets, 6 repetitions (80-85% of 1RM).
- Overload phase 2 (5-10): 2-3 working sets, 4 repetitions (90-95% of 1RM).
The split is basically a push-pull-legs performed 1 day per week in non-consecutive days (Monday, Wednesday, Friday).
Relationship between MT or MRI and myofibrillar protein content
The above studies show that, in most cases, myoP concentration increases after REX and correlates with other measures of muscle hypertrophy (lean mass and fCSA). However, muscle hypertrophy is routinely measured by ultrasound and MRI, which constitue a more direct way of measuring muscle size than DEXA. What is then the relationship between MT, CSA/VOL, and myoP concentration?
Surprisingly, there are not many studies using both methods at the same time. Fortunately, Roberts et al., 2018, measured both MT and myoP concentration (using a purification method that according to the authors is better for purifiying myoP, due to the presence of sufficient detergents to lyse cells and separate membrane components). This study, and a previous one by the same group (Mobley et al., 2018), analyzed the differences between low and high responders to a training intervention.
Briefly, untrained subjects followed a daily undulating periodization (DUP) program, training three times per week with a full body routine (barbell squats, bench press, deadlifts, and bent-over-rows). Absolute training intensities (as % of 1RM) varied for each session per week, including more high intensity sessions (>80% 1RM) towards the second half of the intervention (~50% of total sessions involved training with such intensities). When all subjects were analyzed, lean mass, VL MT and type II fCSA followed the same trend (ie. increased proportionally each). Importantly, measurements were made 72 hours after the last training session.
When separated by VL MT, there was no clear relationship between the increases in MT and either lean mass or type II fCSA (Mobley et al., 2018). Roberts et al., 2018 analyzed a subset of these participants and clustered them according to their response to the training intervention using a composite score that included not only the changes in VL MT, but also including total fCSA and lean mass (DEXA). The results are shown below. Despite significantly differences in lean mass, VL MT and fCSA in the high responders (HI, top 25th percentile) versus the low responders (LO, bottom 25th percentile), neither group experienced significant changes in either myoP or sarcoplasmic protein (sarcoP) concentrations. Expectedly, there were no correlations between the changes in fCSA and myoP content. Interestingly, they also observed that subjects with lower pre myoP and sarcoP experienced greater accumulation of both fractions compared with those with higher levels pre, irrespective of the cluster. Moreover, in 56% of subjects, myoP decreased, independently of changes in VL MT!

As mentioned previously, the authors explained these results by speculating that the changes observed by DEXA, US and fCSA are due to an increase in the intracellular (IC) volume of muscle fibers, not by an increase of myofibrillar content. Interestingly, besides Kadi et al., 2004, a similar scenario is seen when measuring the ACSA by MRI upon training and detraining, where rapid changes (~3 weeks) in muscle size are observed. It seems more likely that these reflect changes in IC volume rather than a drastically increased rate of MPB.
There are other studies that have also shown no relationship between myoP concentration and muscle VOL (MRI) in VL, suggesting that atrophy and hypertrophy (right panel) can occur without changes in muscle protein content in some muscles (VL, left panels).

As shown in the figure above, despite preventing atrophy by unilateral lower limb suspension via resistance exercise (ULLS+RE) (see right part of the figure), the concentration of several muscle proteins was not changed. Therefore, in some cases, large opposite changes in muscle size occur independently of muscle protein concentration.
But there is also more evidence suggesting that changes in muscle size might actually reflect changes in IC volume rather than myofibrillar hypertrophy. A recent study, which measured acute muscle swelling to exercise, showed that swelling increased with subsequent training sessions (instead of being reduced, as suggested by some due to the repeated bout effect). Although the relative change between progressive sessions appears to be attenuated, swelling was still higher than the first session despite performing the same number of sets and no load progression. Additionally, training with lower intensities (loads) promoted a higher acute swelling response.

This agrees with previous data that shows, by increased ultrasound muscle echo intensity (which is correlated with edema), that edema is still present after REX even when muscle damage has been greatly attenuated. It is worth noting that the above measurements were made immediately after training, though it is conceivable that the residual effect days after follows the same magnitude of response.
Perhaps more compelling data comes from Haun et al., 2018, in which the effects of a very high volume routine were determined. This is a particularly interesting study because muscle hypertrophy was measured throughly by US, DXA, bioelectrical impedance spectroscopy (BIS) and fCSA. Trained subjects followed a moderate-intensity (~60% of 1RM, ~4 repetitions in reserve) training routine that involved graded increases in exercise volume until reaching 32 sets per week for 6 weeks. Whereas MT and fCSA data showed surprising results*** (VL MT values decreased from baseline to week 3 at 20 sets, and increased again to basically baseline values at week 6, at 32 sets; biceps MT showed an invese pattern but also ended at 6 weeks similar to baseline values; type II fCSA followed the same pattern as the VL MT, as this muscle was the one that was measured), the most relevant data comes from the BIS water measurements.
Total lean mass gains over the 6 weeks (by DXA) increased linearly by 2.19 kg. During the same period, total body water increased by 1.86 kg, of which most was intracellular water (1.1 kg, 59%), while extracellular water comprised the rest (0.76 kg, 41%). This means that most (85%) of the lean mass gains measured by DXA were fluids. From raw DXA lean mass changes, 50% of total gains were intracellular water, 35% was extracellular water and 15% were non-fluid gains.
Summary
Current methods to assess muscle hypertrophy after REX rely on techniques that cannot differentiate the composition of the muscle and myoP concentration; they only the change in size. Research done on training-detraining after weeks of REX shows that muscle size changes are very dynamic and quick, which is more compatible with fluid shifts rather than with an acute and drastic increase in MPB.
I’ve summarized the studies I have found that measured myoP concentration after REX with some details in the following table:

Most of the studies appear to show an increase in myoP content after REX. When correlating this measurement with other metrics, there is also an apparent correlation between increases in myoP and lean mass (with the exception of Roberts et al., 2007 and Roberts et al., 2018). Unfortunately, to my knowledge, there is only one study which has measured myoP content and MT (Roberts et al., 2018), showing no relationship whatsoever between these two variables. Studies measuring muscle size by MRI agree with the findings from Roberts et al., 2018, showing that changes in muscle volume can occur independently of myoP concentration. Therefore, studies that have used US or MRI do not find a relationship between measurements from these techniques and myoP concentration.
It is interesting to note that the studies that have found an increase in myoP have used training regimens that mostly involve periods high intensity loads (>70-80%). It is possible that the training style, as long suspected by bodybuilders, can influence the effect of REX on myoP. Moreover, studies that have measured changes in muscle size after detraining to date, and which show a rapid decrease in muscle size upon training cessation (Kadi et al., 2004; Ogasawara et al., 2013), have used relatively long periods of training at lower intensities (<80-90%; >8-10RM). Overall, this suggests that training at lower intensities might induce increases in muscle size that are uncoupled from changes in myoP, effectively promoting an increase in sarcoplasmic volume but not myoP. From available data, this “intensity threshold” may lay around 70-80% of 1RM. The idea that there is a relationship between training load/intensity and myoP accretion could also explain the anecdotic observation (genetics aside) on the differences in physiques among competitive bodybuilders. It is commonly observed that bodybuilders who train with high intensities/loads and are incredibly strong display a denser, thicker physique, compared to bodybuilders that train with more volume and use lower loads. They also appear to hold more muscle mass upon training cessation, which would agree with more myoP accumulation, rather than cell volume expansion.
Considering that it is the basis for our current physiological explanation of muscle hypertrophy, it is surprising that myoP concentration is not routinely measured in muscle hypertrophy research. As the studies we have to date are heterogeneous both in the training regimens and the purification techniques used, it is hard to make any strong conclusions. However, it is apparent that measurements by both US and MRI are not well correlated with the concentration of myoP.
Further studies assessing the role of exercise intensity (load) and other variables (eg. tempo, training to failure, etc) on myoP changes after REX should help filling this knowledge gap in the skeletal muscle research field.
* I’m defining “sarcoplasmic hypertrophy” as the increase in cell muscle volume that is not related to increases in myofibrillar protein content, primarly due to fluid expansion. Greg Nuckols has written an article on the subject, although he defines sarcoplasmic hypertrophy as an increase in sarcoplasmic protein content, not volume.
** Changes in muscle echo intensity from US images can suggest differences within muscle tissue, but it appears to be very unspecific.
*** The US data shows that, in some cases, MT measurmenets are uncoupled to changes in fluids.

Lucas! Great name for a blog. I was instantly excited, heh. Looking forward to read more from you. Molecular biology is an area I need to improve. Is there any way to subscribe for updates?
LikeLike
Thanks a lot! Just realized I didn’t approve the comment!
LikeLike
Thank you for this article Lucas. Do you think there is still value in training with loads below 10RM, even if we want to maximize “myofibrillar hypertrophy” (if I may use this simplistic definition)? Things like tendons and joints health, capillarization, preferential targeting of tipe I fibers (see the recent study on powerlifter with BFR) come to mind, but maybe there are more.
LikeLike
Hi Frank, I think it’s ok to train with lower loads as long as over time there is load progression and sets are performed to failure, albeit IMO, less efficient. Mainly added on top of heavy sets to stimulate further high threshold muscle fibers; I like the idea of “back-off sets” in this regard. Once you reached failure at a high load then you reduce the load to allow performing sufficient reps. High threshold fibers should be fatigued by that point and you’ll be able to squeeze some more effective reps after the heavy loading sets. Other variables, such as tempo, also influence the “effectiveness” of a set irrespective of the %RM used.
LikeLike
Thank you for the answer Lucas, very much appreciated. Forgive my probably inappropriate curiosity, but is there a particular training system or coach that you esteem and would like to suggest?
LikeLike
Hi Frank, no problem!
The following are very good sources of information and I would recommend everyone interested in muscle gain and body composition to follow them. These are my go-to sources on training information.
Dr. Scott Stevenson (http://drscottstevenson.com/index.html)
Jordan Peters (http://www.trainedbyjp.com)
Joe Bennett (http://www.hypertrophycoach.com)
I would also search for Dante Trudel’s posts on Intensemuscle.com and ProfessionalMuscle.com. I think he is preparing something new but still hasn’t launched anything yet.
LikeLike
Hi Lucas.
I really like your articles, and your insightful view of the resistance training literature.
I always found interesting that research shows an increase in MPS in advanced trainees, yet little to no growth.
https://www.ncbi.nlm.nih.gov/pmc/articles/PMC6016534/
https://www.ncbi.nlm.nih.gov/pubmed/28543604
https://www.ncbi.nlm.nih.gov/pubmed/1592744
https://evidencebasedfitness.net/protein-synthesis-muscle-hypertrophy-no-proxies/
Best regards.
LikeLike
Hi Ignacio,
Thanks for your comment and links. I specifically avoided touching upon MPS and hypertrophy in detail to not dilute the article too much, but maybe a follow up post should come up soon on this. Sufficient to say, I don’t think that extrapolating higher myofibrillar MPS to higher hypertrophy is warranted. I also think one of the problems in the literature is how “trained” is defined in different studies. I would be more inclined to use some strength and/or bodycomposition metric rather than training age.
All the best,
Lucas
LikeLike
Hi Lucas,
Thanks for your answer.
“I don’t think that extrapolating higher myofibrillar MPS to higher hypertrophy is warranted.” I agree 100%.
Regarding training status, have you read this paper?
https://onlinelibrary.wiley.com/doi/full/10.1002/mus.25461
Best,
Ignacio
LikeLike
Lucas, did you have a chance to take a look at the latest paper by Cody Haun et al., https://www.frontiersin.org/articles/10.3389/fphys.2019.00247/full ? I know that probably you did, but I would love to read your opinion about it, since it seems very relevant to this post.
I’m a layman, so I’m not able to properly evaluate a study, but I’ve read a synopsis of it on Facebook and it seems like it has interesting implications on training volume and sarcoplasmic hypertrophy.
LikeLike
Hey Frank,
I haven’t read it in detail, only skimmed through it and read some sections but was aware it as Cody reviewed my article and we corresponded a little bit. I have to give it a more careful read but from what I’ve seen its very good and offers a very nice historical perspective. What exactly were the implications you read?
LikeLike
Hi Lucas, the synopsis that I was talking about is on a recent post on the SSD group on Facebook. It’s quite detailed, but from what I’ve got from it, high training volumes are more correlated with sarcoplasmic hypertrophy.
LikeLike